PETRUS ROMANUS

MATRIZ ROTAÇÃO
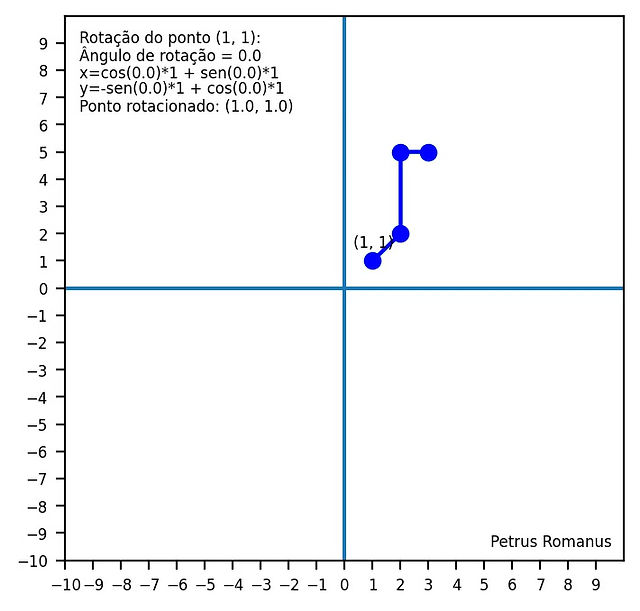
Uma importantíssima aplicação das operações com matrizes: rotação de pontos e figuras. Com o código abaixo, é possível criar a seguinte animação:
import matplotlib.pyplot as plt
from math import sin, cos, radians
import numpy as np
ang = radians(0)
x_o = [1,2,2,3]
y_o = [1,2,5,5]
for r in range(722):
x_r = []
y_r = []
for i in range (len(x_o)):
x_r.append(cos(ang) * x_o[i] + sin(ang) * y_o[i])
y_r.append(-sin(ang) * x_o[i] + cos(ang) * y_o[i])
i = 0
plt.axis([-10,10,-10,10])
plt.xticks(np.arange(-10,10,1), fontsize=6)
plt.yticks(np.arange(-10,10,1), fontsize=6)
plt.axhline(0)
plt.axvline(0)
plt.plot(x_o,y_o,"oc")
plt.plot(x_o,y_o,"c")
plt.plot(x_r,y_r,"ob")
plt.plot(x_r,y_r,"b")
plt.text(-9.5,9.0,"Rotação do ponto (1, 1):", fontsize = 6)
plt.text(-9.5,8.35,"Ângulo de rotação = " + str(ang)[0:4], fontsize = 6)
plt.text(-9.5,7.7, "x=cos(" + str(ang)[0:4] + ")*" +
str(x_o[i]) + " + sen(" + str(ang)[0:4] + ")*" +
str(y_o[i]), fontsize = 6)
plt.text(-9.5,7.15, "y=-sen(" + str(ang)[0:4] + ")*" +
str(x_o[i]) + " + cos(" + str(ang)[0:4] + ")*" +
str(y_o[i]), fontsize = 6)
plt.text(-9.5,6.5,"Ponto rotacionado: " + "(" + str(x_r[i])[0:4] + ", " + str(y_r[i])[0:4] + ")", fontsize = 6)
plt.text(0.3,1.5,"(1, 1)", fontsize=6)
plt.text(5.2, -9.5, "Petrus Romanus", fontsize=6)
ang = ang + radians(0.5)
plt.pause(0.001)
plt.show()